- Snapshot of your Return on Investment (ROI) for a specified date range
- Which scopes (SharePoint Online, Yammer, OneDrive, PowerApps, etc.) are being used
- Search terms users are looking for within the VisualSP Help panel
- What Help items were viewed by each user
- Which Help items are seeing the most engagement/most valuable, and by whom
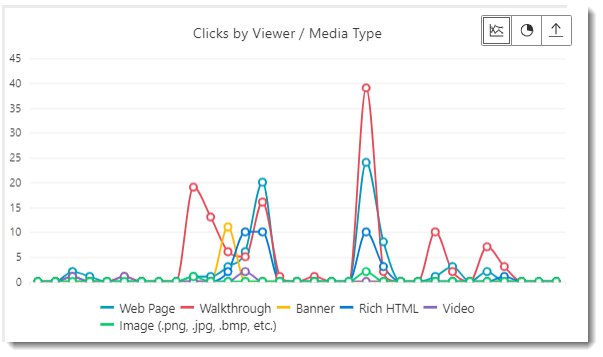
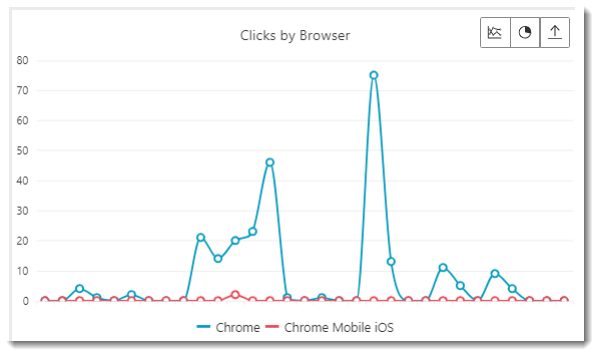
- Clicks by browser and media type
To view the analytics:
- Click the Help tab to open the Help panel
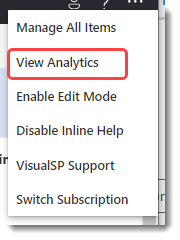
- From the hamburger menu, click on View Analytics
- A Return on Investment (ROI) snapshot will display at the top of the Analytics page.
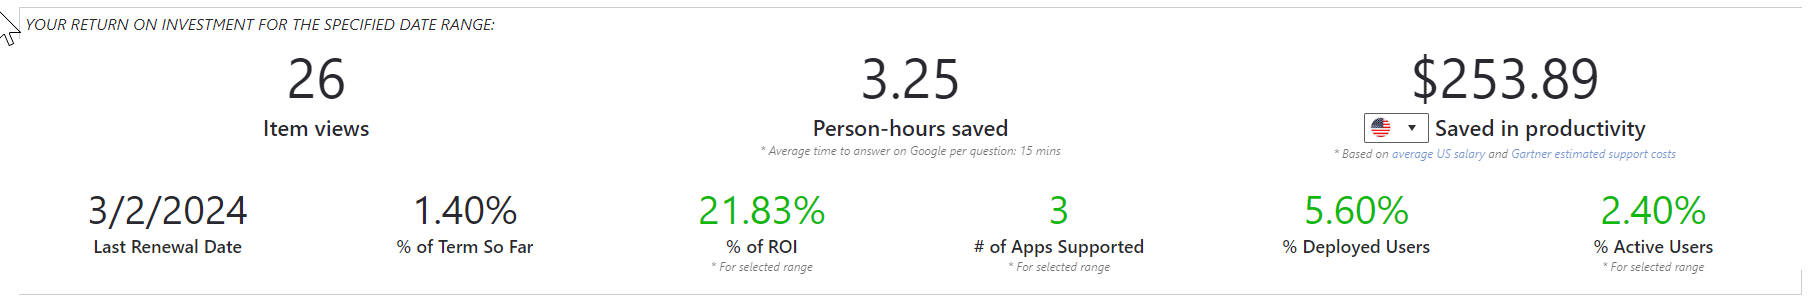
The green numbers shown are the core KPIs for building ROI with your VisualSP subscription. Your Customer Success manager will help you set goals that meet your intended use case(s). The Analytics page will then color-code these KPIs based on your goals.
NOTE on ROI calculations: The Person-hours saved data is calculated based reducing time lost searching for an answer to how-to questions. Each 'qualified help item view' (a unique user viewing a unique help item during a calendar month) is estimated to save 15 minutes for that user. The Dollars save in productivity is also calculated per 'qualified help item view', using average salary savings for information workers ($7.87) and Gartner-calculated cost savings for IT Support ($11.66).- The $7.87 is based on an average salary for information workers ($65470/52w/40h/4) - effectively providing an average wage for 15 minutes of work).
- The $11.66 is calculated based on a Gartner study which states that the cost for a support inquiry through a self-service channel (like VisualSP) is $1.84, whereas the cost for a support inquiry using a human-assisted channel is $13.50. Our multiplier uses the difference between these costs.
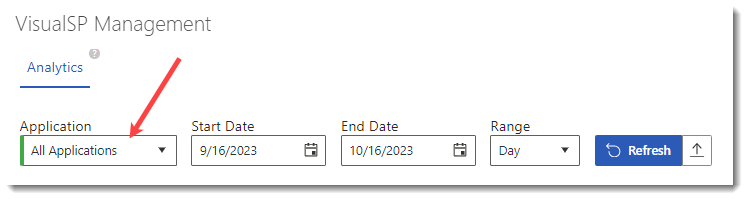
- Below the ROI snapshot, you will find filter options that default to show usage for All Applications over the past 30 days.
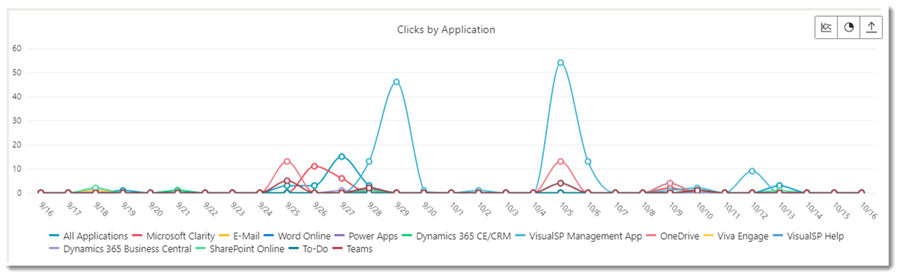
- Clicks by Application. This chart displays the number of help items clicked on by application and helps you visualize where your Help items are used most.
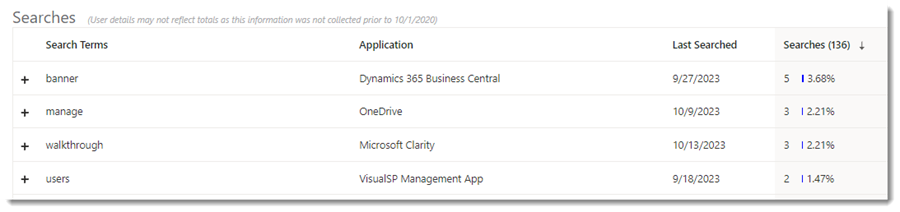
- The Searches section displays search terms your users are looking for within the VisualSP Help panel. It is important to regularly review this section so that you can spot questions that you can answer with a custom Help item.
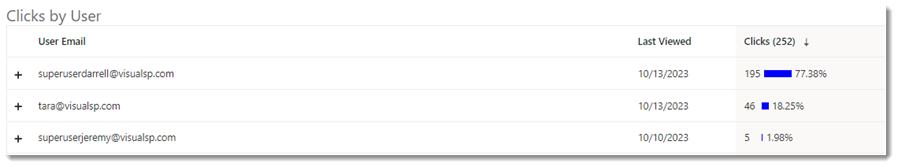
- Clicks by User displays the Help items clicked on by each user. Click on the plus sign next to a user email address to view which help items have been consumed by that user. Click on the download icon to export the data as a CSV file. To protect user's privacy, you have the option of displaying GUIDs (globally unique identifiers), which will replace user's email addresses and display random numbers instead. Send an email to [email protected] to request that this option be activated in your environment.
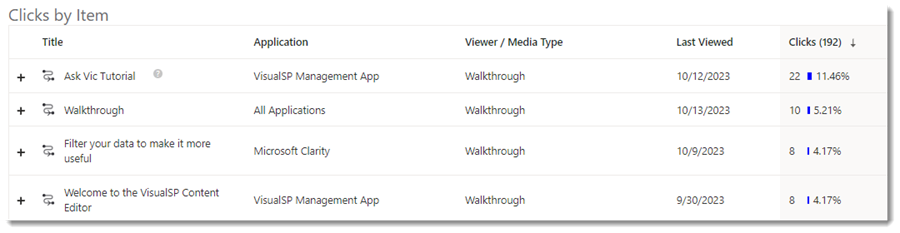
- Clicks by Help Item shows you which Help items are seeing the most engagement, and who has clicked on each one:
- Clicks by Browser displays which browsers your users are using. You can view data as a line chart, pie chart, or download the data as a CSV file
- Clicks by Viewer / Media Type displays which media types are being consumed: